Identify capabilities of Power BI
When you dive into Power BI, you’re immersing yourself in a universe of functionalities, each tailored to elevate your data visualization and analytical skills. Here’s a guide to help you navi-gate and harness the essential capabilities of this remarkable tool.
- Seamless data integration: At the heart of every great visualization lies the data that drives it. With Power BI you can connect effortlessly to a diverse range of data sources, be it local databases, cloud-based solutions, Excel spreadsheets, or third-party plat-forms, as shown in Figure 4-21. The beauty of it is that once the data is connected, you can consolidate and transform that data, paving the way for rich, meaningful visualizations.
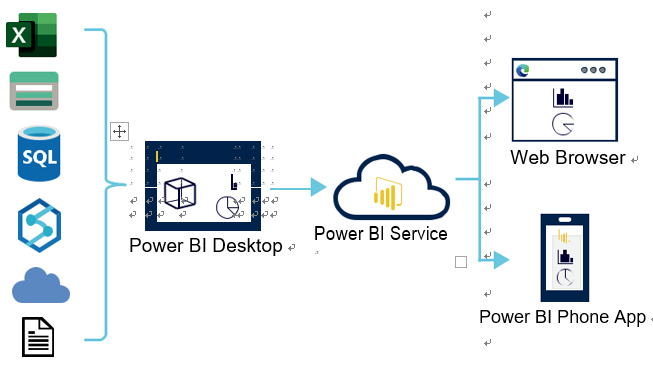
FIGURE 4-21 Power BI data ingestion process
- Intuitive drag-and-drop features: You don’t need to be a coding wizard to craft com-pelling visuals in Power BI. With its user-friendly interface, designing everything from simple charts to complex dashboards becomes an intuitive, drag-and-drop affair. Pic-ture yourself effortlessly juxtaposing a line graph next to a pie chart, bringing multiple data stories into a coherent narrative.
- Advanced data modeling: Beyond its visualization prowess, Power BI arms you with robust data modeling tools. With features like Data Analysis Expressions (DAX), you can create custom calculations, derive new measures, and model your data in ways that resonate best with your analysis needs.
128 CHAPTER 4 Describe an analytics workload on Azure
- Interactive reports and dashboards: Static visuals tell only half the story. With Power BI, your visualizations come alive, offering interactive capabilities that encourage exploration. Imagine a sales dashboard where clicking a region dynamically updates all associated charts, revealing granular insights with a mere click.
- Collaboration and sharing: Crafting the perfect visualization is one thing; sharing it is another. Power BI streamlines collaboration, meaning you can publish reports, share dashboards, and even embed visuals into apps or websites. Your insights, once confined to your device, can now reach a global audience or targeted stakeholders with ease.
As a practical example, consider you’re managing the sales division for a global enter-prise. With Power BI, you can effortlessly integrate sales data from various regions, model it to account for currency differences, and craft a dynamic dashboard. Now, with a simple click, stakeholders can dive into regional sales, identify top-performing products, and even forecast future trends. As your proficiency with Power BI grows, there’s always more to discover. As you chart your data journey with Power BI, remember that every insight you unearth has the potential to inform, inspire, and innovate.