Skill 4.3 Describe data visualization in Microsoft Power BI
Dive into the transformative world of data visualization with Microsoft Power BI, a tool that not only brings your data to life but also empowers you to extract insights with unparalleled ease and finesse. As you delve deeper into this segment, imagine the vast swathes of data, currently sitting in spreadsheets or databases and metamorphosing into vibrant charts, intricate graphs, and interactive dashboards. With Power BI, you can tailor every detail of your visualizations to your precise needs.
Picture a dashboard where sales metrics, customer demographics, and operational efficien-cies merge seamlessly, with each visual element telling its part of the larger story, as shown in Figure 4-20. That’s the promise of Power BI, a canvas where data finds its voice. And while the visual elements captivate, remember that beneath them lie robust analytical capabilities. Want to drill down into a specific data point? Curious about trends over time? Power BI is more than up to the task, offering you both the broad view and the minute details.
In this section, you’ll encounter vivid examples that underscore the versatility and power of Power BI. From crafting simple bar charts to designing multidimensional maps, you’ll learn the art and science of making data dance to your tune.
And while our guidance here is comprehensive, Power BI’s expansive capabilities mean
there’s always more to explore. Consider referring to Microsoft’s official resources for deeper dives, advanced tutorials, and community-driven insights. Let’s embark on this enlightening journey, ensuring that, by its end, you’re not just a data analyst but also a data storyteller.
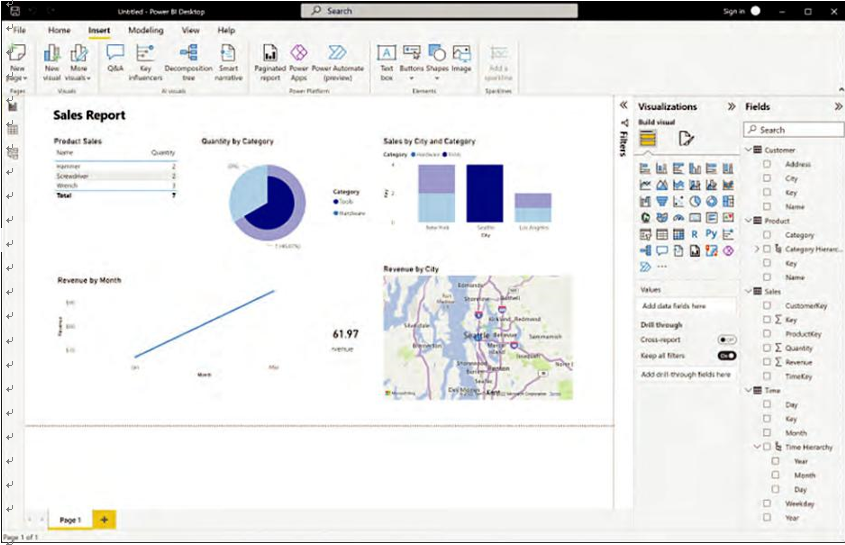
FIGURE 4-20 Power BI interactive dashboard
Skill 4.3 Describe data visualization in Microsoft Power BI CHAPTER 4 127
This skill covers how to:
- Identify capabilities of Power BI
- Describe features of data models in Power BI
- Identify appropriate visualization for data