Azure Stream Analytics
In today’s data-driven world, the need to react immediately to unfolding events has never been greater. Picture yourself on the trading floor, where milliseconds can decide millions. Or consider a bustling metropolis where urban sensors constantly monitor traffic, air quality, and energy consumption. Azure Stream Analytics is Microsoft’s answer to the challenges of real-time data ingestion, processing, and analytics.
Azure Stream Analytics is a real-time event data processing service that you can use to har-ness the power of fast-moving streams of data. But what does it really mean for you?
WHY AZURE STREAM ANALYTICS?
Azure Stream Analytics brings the following tools to your toolkit:
■■ Seamless integration: Azure Stream Analytics beautifully integrates with other Azure services. Whether you’re pulling data from IoT Hub, Event Hub, or Blob Storage, Stream Analytics acts as your cohesive layer, processing and redirecting the data to databases, dashboards, or even other applications, as shown in Figure 4-17.
■■ SQL-based query language: You don’t need to be a programming wizard to harness Azure Stream Analytics. If you’re familiar with SQL, you’re already ahead of the curve. Stream Analytics employs a SQL-like language, allowing you to create transformation queries on your real-time data.
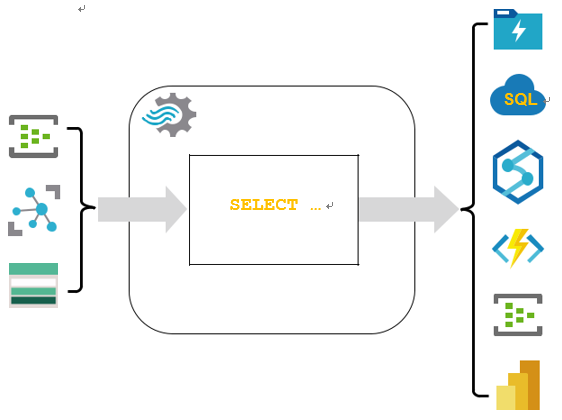
FIGURE 4-17 Azure Stream Analytics
■■ Scalability and reliability: One of the hallmarks of Azure Stream Analytics is its abil-ity to scale. Whether you’re processing a few records or millions every second, Stream Analytics can handle it. More so, its built-in recovery capabilities ensure that no data is lost in the case of failures.
122 CHAPTER 4 Describe an analytics workload on Azure
■■ Real-time dashboards: Azure Stream Analytics is not just about processing; it’s also about visualization. With its ability to integrate seamlessly with tools like Power BI, you can access real-time dashboards that update as events unfold.
■■ Time windowing: One of the stand-out features you’ll appreciate is the ease with which you can perform operations over specific time windows—be it tumbling, sliding, or hopping. For instance, you might want to calculate the average temperature from IoT sensors every five minutes; Stream Analytics has got you covered.
Tumbling window in stream processing refers to a fixed-duration, nonoverlapping interval used to segment time-series data. Each piece of data falls into exactly one window, defined by a distinct start and end time, ensuring that data groups are mutu-ally exclusive. For instance, with a 5-minute tumbling window, data from 00:00 to 00:04 would be aggregated in one window, and data from 00:05 to 00:09 in the next, facilitat-ing structured, periodic analysis of streaming data.
Sliding window in stream processing is a type of data analysis technique where the window of time for data aggregation “slides” continuously over the data stream. This means that the window moves forward by a specified slide interval, and it overlaps with previous windows. Each window has a fixed length, but unlike tumbling windows, sliding windows can cover overlapping periods of time, allowing for more frequent analysis and updates. For example, if you have a sliding window of 10 minutes with a slide interval of 5 minutes, a new window starts every 5 minutes, and each window overlaps with the previous one for 5 minutes, providing a more continuous and overlapping view of the data stream.
Hopping window in stream processing is a time-based window that moves forward in fixed increments, known as the hop size. Each window has a specified duration, and the start of the next window is determined by the hop size rather than the end of the previ-ous window. This approach allows for overlaps between windows, where data can be included in multiple consecutive windows if it falls within their time frames. For example, with a window duration of 10 minutes and a hop size of 5 minutes, a new window starts every 5 minutes, and each window overlaps with the next one for a duration determined by the difference between the window size and the hop size.
■■ Anomaly detection: Dive into the built-in machine learning capabilities to detect anomalies in your real-time data streams. Whether you’re monitoring web clickstreams or machinery in a factory, Azure Stream Analytics can alert you to significant deviations in patterns.
As a practical example to truly appreciate the potential of Azure Stream Analytics, consider a smart city initiative. Urban sensors, spread across the city, send real-time data about traf-fic, energy consumption, and more. Through Azure Stream Analytics, this data is ingested in real time, processed to detect any irregularities such as traffic jams or power surges, and then passed on to Power BI dashboards that city officials monitor. The officials can then take imme-diate action, such as rerouting traffic or adjusting power distribution.
Skill 4.2 Describe consideration for real-time data analytics CHAPTER 4 123
In summary, Azure Stream Analytics is a tool for those yearning to transform raw, real-time data streams into actionable, meaningful insights. And as you delve deeper into its features and integrations, you’ll realize that its possibilities are vast and ever-evolving.