Identify Microsoft cloud services for real-time analytics – Describe an analytics workload on Azure

Identify Microsoft cloud services for real-time analytics

In an age where decisions must often be made at the blink of an eye, the role of real-time analytics has become paramount. The ability to rapidly sift through vast streams of data, distill meaningful insights, and act on them instantaneously can often mean the difference between seizing an opportunity or missing it entirely. But beyond the buzzwords, what does real-time analytics truly entail, especially when you’re navigating the vast offerings of the Azure ecosys-tem? This section will guide you through Azure’s real-time analytics technologies, demystifying their capabilities and applications and setting you on a course to harness their full potential. From understanding the prowess of Azure Stream Analytics to grasping the nuances of Azure Synapse Data Explorer and Spark structured streaming, you’re about to get to the heart of instant data processing and analytics.

■ Stream processing platforms: At the center stage of real-time analytics are stream processing platforms. A stalwart example is Azure Stream Analytics, which you can use to ingest, process, and analyze data as it flows. To visualize its power, consider moni-toring a vast power grid, instantly detecting surges, and redirecting power to prevent outages. Just like the grid managers, you can harness Azure Stream Analytics to react immediately to your business’s data.

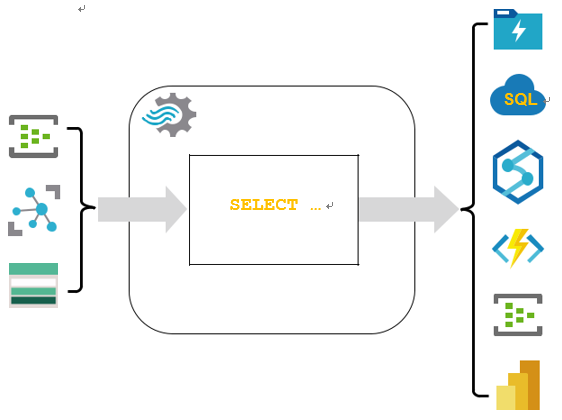
■ Azure Synapse Data Explorer: This isn’t just another tool—it’s your window into the massive streams of data you’re dealing with. With Azure Synapse Data Explorer you can

120 CHAPTER 4 Describe an analytics workload on Azure

query, visualize, and explore your data in real time. It’s like having a magnifying glass over a rushing river of data, where you can pick out and examine individual drops (or data points) as they flow by.

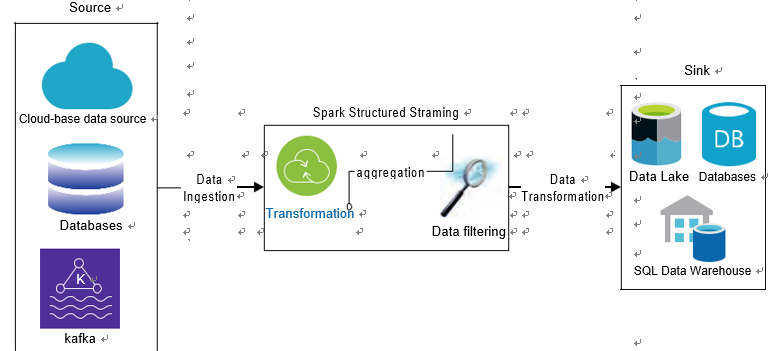
■■ Spark Structured Streaming: An integral part of the Apache Spark ecosystem, Spark Structured Streaming facilitates scalable and fault-tolerant stream processing of live data streams. Imagine standing amidst a bustling stock market, with traders shouting orders and prices fluctuating wildly. Now, imagine you could process, aggregate, and make sense of all that data in real time. That’s the magic Spark Structured Streaming brings to the table. Figure 4-16 shows you streaming lines of data converging into structured blocks of information.

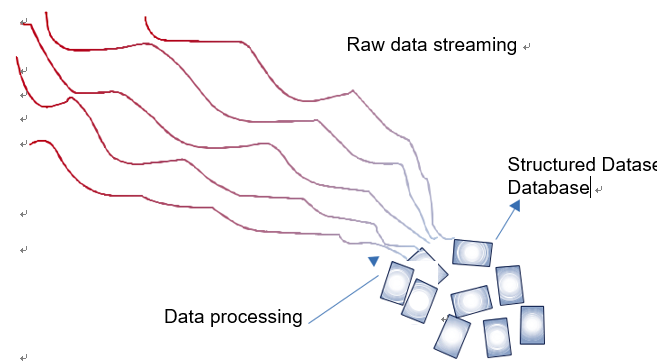
FIGURE 4-16 Streaming data converging into structured datasets

■■ Message brokers: Azure Event Hubs stands tall as a premier message broker. As you navigate the labyrinth of real-time data, you’ll realize the critical role of these brokers in ensuring data is delivered reliably and promptly to the systems that process them. It’s the backbone, the silent carrier ensuring every piece of data reaches its destination.

■■ NoSQL databases: In the realm of real-time data, traditional databases can become bottlenecks. This is where powerhouses like Cosmos DB shine. Designed for breakneck speeds and unmatched scalability, they provide the storage that might be required for the deluge of real-time data. If you’ve ever wondered how global social media platforms can show trending topics within seconds of an event unfolding, NoSQL databases are a big part of that answer.

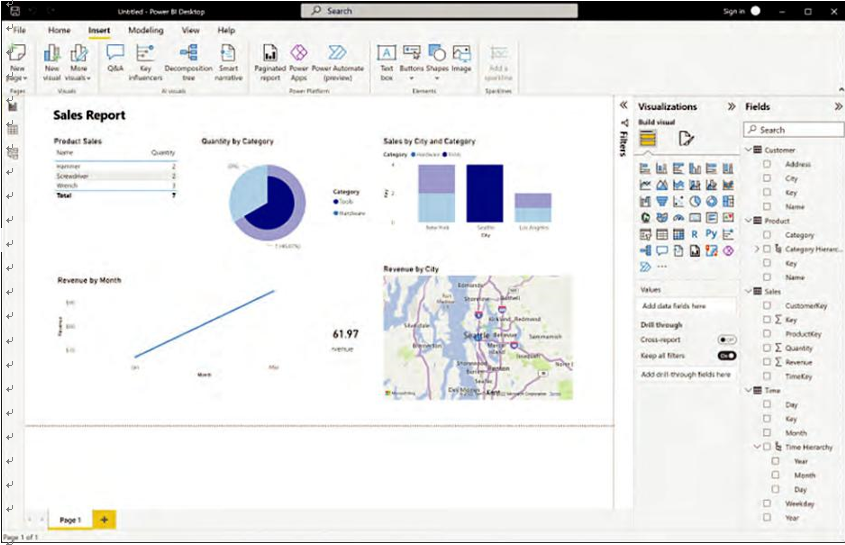
■■ Data visualization tools: The journey from data to decision is completed when insights are visualized and made actionable. Power BI serves as a beacon here, integrating with real-time analytics platforms to deliver live data dashboards. These aren’t just numbers and graphs; they’re the pulse of your operations, showcased in real time.

The ecosystem of real-time analytics is vast and ever-evolving. As you delve deeper, be pre-pared to witness the symphony of technologies working in unison, each playing its unique note in the grand composition of real-time insights. Each technology, be it Azure Stream Analytics,

Skill 4.2 Describe consideration for real-time data analytics CHAPTER 4 121

Azure Synapse Data Explorer, or Spark Structured Streaming, has its own nuances, applications, and potentials.

Semi-structured Data – Core Data Concepts

Semi-structured Data

Semi-structured data has some structure to it but no defined schema. This allows data to be written to and read from very quickly since the storage engine does not reorganize the data to meet a rigid format. While the lack of a defined schema naturally eliminates most of the data volatility concerns that come with structured data, it makes analytical queries more complicated as there isn’t a reliable schema to use when creating the query.

The most popular examples of semi-structured datasets are XML and JSON files. JSON specifically is very popular for sharing data via a web API. JSON stores data as objects in arrays, which allows an easy transfer of data. Both XML and JSON formats have somewhat of a structure but are flexible enough that some objects may have more or fewer attributes than others. Because the structure of the data is more fluid than that of a database with a schema, we typically refer to querying semi-structured data as schema-on-read. This means that the query definition creates a sort of quasi-schema for the data to fit in. Figure 1.6 demonstrates how JSON can be used to store data for multiple customers while including different fields for each customer.

There are multiple ways that we can store semi-structured data, varying from NoSQL databases such as Azure Cosmos DB (see Chapter 3) to files in an Azure storage account (see Chapter 4). Relational databases such as SQL Server, Azure SQL Database, and Azure Synapse Analytics can also handle semi-structured data with the native JSON and XML data types. While this creates a convenient way for data practitioners to manage structured and semi-structured data in the same location, it is recommended to limit the amount of semi-structured data you store in a relational database to very little or none.

Semi-structured data can also be stored in other types of NoSQL data stores, such as key-value stores, columnar databases, and graph databases.

FIGURE 1.6 JSON example

Azure Stream Analytics – Describe an analytics workload on Azure

Azure Stream Analytics

In today’s data-driven world, the need to react immediately to unfolding events has never been greater. Picture yourself on the trading floor, where milliseconds can decide millions. Or consider a bustling metropolis where urban sensors constantly monitor traffic, air quality, and energy consumption. Azure Stream Analytics is Microsoft’s answer to the challenges of real-time data ingestion, processing, and analytics.

Azure Stream Analytics is a real-time event data processing service that you can use to har-ness the power of fast-moving streams of data. But what does it really mean for you?

WHY AZURE STREAM ANALYTICS?

Azure Stream Analytics brings the following tools to your toolkit:

■■ Seamless integration: Azure Stream Analytics beautifully integrates with other Azure services. Whether you’re pulling data from IoT Hub, Event Hub, or Blob Storage, Stream Analytics acts as your cohesive layer, processing and redirecting the data to databases, dashboards, or even other applications, as shown in Figure 4-17.

■■ SQL-based query language: You don’t need to be a programming wizard to harness Azure Stream Analytics. If you’re familiar with SQL, you’re already ahead of the curve. Stream Analytics employs a SQL-like language, allowing you to create transformation queries on your real-time data.

FIGURE 4-17  Azure Stream Analytics

■■ Scalability and reliability: One of the hallmarks of Azure Stream Analytics is its abil-ity to scale. Whether you’re processing a few records or millions every second, Stream Analytics can handle it. More so, its built-in recovery capabilities ensure that no data is lost in the case of failures.

122 CHAPTER 4     Describe an analytics workload on Azure

■■ Real-time dashboards: Azure Stream Analytics is not just about processing; it’s also about visualization. With its ability to integrate seamlessly with tools like Power BI, you can access real-time dashboards that update as events unfold.

■■ Time windowing: One of the stand-out features you’ll appreciate is the ease with which you can perform operations over specific time windows—be it tumbling, sliding, or hopping. For instance, you might want to calculate the average temperature from IoT sensors every five minutes; Stream Analytics has got you covered.

Tumbling window in stream processing refers to a fixed-duration, nonoverlapping interval used to segment time-series data. Each piece of data falls into exactly one window, defined by a distinct start and end time, ensuring that data groups are mutu-ally exclusive. For instance, with a 5-minute tumbling window, data from 00:00 to 00:04 would be aggregated in one window, and data from 00:05 to 00:09 in the next, facilitat-ing structured, periodic analysis of streaming data.

Sliding window in stream processing is a type of data analysis technique where the window of time for data aggregation “slides” continuously over the data stream. This means that the window moves forward by a specified slide interval, and it overlaps with previous windows. Each window has a fixed length, but unlike tumbling windows, sliding windows can cover overlapping periods of time, allowing for more frequent analysis and updates. For example, if you have a sliding window of 10 minutes with a slide interval of 5 minutes, a new window starts every 5 minutes, and each window overlaps with the previous one for 5 minutes, providing a more continuous and overlapping view of the data stream.

Hopping window in stream processing is a time-based window that moves forward in fixed increments, known as the hop size. Each window has a specified duration, and the start of the next window is determined by the hop size rather than the end of the previ-ous window. This approach allows for overlaps between windows, where data can be included in multiple consecutive windows if it falls within their time frames. For example, with a window duration of 10 minutes and a hop size of 5 minutes, a new window starts every 5 minutes, and each window overlaps with the next one for a duration determined by the difference between the window size and the hop size.

■■ Anomaly detection: Dive into the built-in machine learning capabilities to detect anomalies in your real-time data streams. Whether you’re monitoring web clickstreams or machinery in a factory, Azure Stream Analytics can alert you to significant deviations in patterns.

As a practical example to truly appreciate the potential of Azure Stream Analytics, consider a smart city initiative. Urban sensors, spread across the city, send real-time data about traf-fic, energy consumption, and more. Through Azure Stream Analytics, this data is ingested in real time, processed to detect any irregularities such as traffic jams or power surges, and then passed on to Power BI dashboards that city officials monitor. The officials can then take imme-diate action, such as rerouting traffic or adjusting power distribution.

Skill 4.2 Describe consideration for real-time data analytics     CHAPTER 4      123

In summary, Azure Stream Analytics is a tool for those yearning to transform raw, real-time data streams into actionable, meaningful insights. And as you delve deeper into its features and integrations, you’ll realize that its possibilities are vast and ever-evolving.

Unstructured Data – Core Data Concepts

Unstructured Data

Unstructured data is used to describe everything that doesn’t fit in the structured or semi-structured classification. PDFs, images, videos, and emails are just a few examples of unstructured data. While it is true that unstructured data cannot be queried like structured or semi-structured data, deep learning and artificial intelligence (AI) applications can derive valuable insights from them. For example, applications using image classification can be trained to find specific details in images by comparing them to other images.

Storing unstructured data is easier today than it has ever been. As mentioned previously, Azure Blob Storage allows companies and individuals the ability to store exabytes of data in any format. While this exam does not cover the many applications of unstructured data, it is important to note that unstructured data is becoming more and more vital for companies to gain a competitive edge in today’s world.

Data Velocity

The speed at which data is processed is commonly known as data velocity. Requirements for data processing are largely dependent on what business problem or problems we are trying to solve. Raw data such as football player statistics could be stored as raw data until every game for a given week is finished before it is transformed into insightful information. This type of data processing where data is processed in batches is commonly referred to as batch processing. We can also process data from sensors located on equipment that a player is wearing in real time so that we can monitor player performance as the game is happening. This type of data processing is called stream processing.

Batch Processing

Batch processing is the practice of transforming groups, or batches, of data at a time. This process is also known as processing data at rest. Traditional BI platforms relied on batch processing solutions to create meaningful insights out of their data. Concert venues would leverage technologies such as SQL Server to store batch data and SQL Server Integration Services (SSIS) to transform transactional data on a schedule into information that could be stored in their data warehouse for reporting. Many of the same concepts apply today for batch processing, but cloud computing gives us the scalability to process exponentially more data. Distributed computing paradigms such as Hadoop and Spark allow organizations to use compute from multiple commodity servers to process large amounts of data in batch.

Batch processing is typically done in a process of jobs automated by an orchestration service such as Azure Data Factory (ADF). These jobs can be run one by one, in parallel, or a mix of both depending on the requirements for the solution these jobs are a part of. Automated batch jobs can be run after a certain data threshold is reached in a data store but are more often triggered one of two ways:

  • On a recurring schedule—an ADF pipeline running every night at midnight, or on a periodic time interval starting at a specified start time.
  • Event/trigger-based—an ADF pipeline running after a file is uploaded to a container in Azure Blob Storage.

It is also critical that batch processing includes error handling logic that acts on a failed job. A common architecture pattern that handles batch processing in Azure is illustrated in Figure 1.7.

FIGURE 1.7 Common architecture for batch processing in Azure

There is quite a bit going on in the diagram in Figure 1.7, so let’s break it down step-by-step:

  • Data is loaded from disparate source systems into Azure. This could vary from raw files being uploaded to a central data repository such as Azure Data Lake Storage Gen2 (ADLS) to data being collected from business applications in an OLTP database such as Azure SQL Database.
  • Raw data is then transformed into a state that is analytics and report ready. Here, we can choose between code-first options such as Azure Databricks to have complete control over how data is transformed or GUI-based technologies such as Azure Data Factory Data Flows. Both options can be executed as activities in an ADF pipeline.
  • Aggregated data is loaded into an optimized data store ready for reporting. Depending on the workload and the size of data, an MPP data warehouse such as Azure Synapse Analytics dedicated SQL pool can be used to optimally store data that is used for reporting.
  • Data that is ready to be reported is then analyzed through client-native applications or a business intelligence tool such as Power BI.

Stream Processing – Core Data Concepts

Stream Processing

Instead of processing groups of data at scheduled intervals as you would with batch processing, stream processing performs actions on data in real time as it is generated. The proliferation of connected applications and IoT sensor devices in recent years has led to a boom in the amount of data sources that can stream data. Organizations that leverage data streams are able to innovate at an on-the-go pace, allowing them to instantly respond to the needs of their customers.

You can think of a stream of data as a continuous flow of data from some source, also known as a message producer. Each piece of data in a stream is often referred to as an event or a message and typically arrives in an unstructured or semi-structured format such as JSON. The following list includes some examples of stream processing:

  • An e-commerce company analyzing click-stream data as consumers are browsing the company’s website to provide product recommendations in real time
  • Fitness trackers streaming heart rate and movement data to a mobile app and providing real-time updates of the wearer’s workout efficiency
  • Financial institutions tracking stock market changes in real time and automatically making portfolio decisions as stock prices change
  • Oil companies monitoring the status of pipelines and drilling equipment

While these examples include the same transformation activities as many batch processes, they have vastly shorter latency requirements.

Stream processing is just one step in designing a real-time data processing solution. The following logical components will need to be considered when designing a real-time solution:

  • Real-time message ingestion—The architecture must include a way to capture and store real-time messages regardless of the technology that is creating the stream of data. Message brokers such as Azure Event Hubs, Azure IoT Hub, and Apache Kafka are used to ingest millions of events per second from one or many message producers. These technologies will then queue messages before sending them to the next appropriate step in the architecture. Most of the time this will be a processing engine of some type, but some solutions will require sending the raw messages to a long-term storage solution such as Azure Blob Storage or ADLS for future batch analysis.
  • Stream processing—Stream processing engines are the compute platforms that process, aggregate, and transform data streams. Technologies such as Azure Functions, Azure Stream Analytics, and Azure Databricks Structured Streaming can create time-boxed insights data that is queued in a real-time message broker. These technologies will then write the results to message consumers such as an analytical data store or a reporting tool that can display real-time updates.
  • Analytical data store—Processed real-time data can be written to databases such as Azure Synapse Analytics, Azure Data Explorer, and Azure Cosmos DB that power analytical applications.
  • Analysis and reporting—Instead of being written to an analytical data store first, processed real-time data can be published directly from the stream processing engine to report applications like Power BI.

Describe Data Analytics Core Concepts – Core Data Concepts

Describe Data Analytics Core Concepts

The process of taking raw data and turning it into useful information is known as data analytics. Companies that invest in sophisticated, well-designed data analytics solutions do so to discover information that helps the overall performance of the organization. Finding new opportunities, identifying weaknesses, and improving customer satisfaction are all results that come from data analytics. This involves building a repeatable solution that collects data from the appropriate source systems, transforms it into dependable information, and serves it in a way that is easy to consume.

One example of an end-to-end data analytics solution is a sports franchise that would like to build a fan engagement solution to improve stadium attendance rates and in-stadium retail sales by retaining more season ticketholders and creating incentive-based programs for different fan groups. The first step to create this solution will be to identify the sources of data that will be most useful to answering questions related to who attends games and what external factors may influence attendance rates. The next step will be to take these disparate sources of data and transform them so that they present a reliable view of the data that can be easily read by consumers who are acting on the data. For example, consumers of the data could be data scientists who develop regression models that predict future stadium attendance or analysts who build reports and dashboards that display in-stadium trends for different fan groups. These actions are then used to create decisions that will enhance ticket sales and operational efficiency during a game.

Data Processing Techniques

The most critical part of a data analytics solution is that the result set is clean, reliable data. Consumers of the data must be able to retrieve the same answer from a question, regardless of how the question is presented to the data model. There cannot be a question of the quality of data being reported on. This is the goal of data processing.

Simply put, data processing is the methodology used to ingest raw data and transform it into one or more informative business models. Data processing solutions will ingest data either in batches or as a stream and can either store the data in its raw form or begin transforming it. Data can undergo several transformations before it is ready to be reported on. Some of the most common transformation activities are as follows:

  • Filtering out corrupt, duplicated, or unnecessary data
  • Joining data or appending it to other datasets
  • Normalizing data to meet a standard nomenclature
  • Aggregating data to produce summarizations
  • Updating features to a more useful data type

Data processing pipelines must include activities that are repeatable and flexible enough to handle a variety of scenarios. Tools such as ADF, Azure Databricks, and Azure Functions can be used to build processing pipelines that use parameters to produce desired results. These tools also allow developers to include error handling logic in their processing pipelines to manage how pipelines proceed if processing errors present themselves without bringing the pipeline to a screeching halt.

Cloud-based data processing solutions make it easy to store data after multiple stages of transformations. Storage solutions such as ADLS allow organizations to store massive amounts of data very cheaply in folders designated for raw data that was just ingested, data that has been filtered and normalized, and data that has been summarized and modeled for reporting. This allows data processing solutions to reuse data at any point in time to validate actions taken on the data and produce new analysis from any point in the data’s life cycle.

There are two data processing approaches that can be taken when extracting data from source systems, transforming it, and loading the processed information into a data model. These approaches are extract, transform, and load (ETL) and extract, load, and transform (ELT). Choosing between them depends on the dependency between the transformation and storage engines.

Spark Structured Streaming – Describe an analytics workload on Azure

Spark Structured Streaming

In today’s fast-paced digital landscape, staying ahead often requires having the right tools to process and analyze streaming data seamlessly. While there are numerous technologies at the forefront of this revolution, Apache Spark’s Structured Streaming stands out as an exceptional choice. This section will guide you through its intricacies, helping you grasp its underpinnings and recognize how it can be a game-changer in your real-time analytics endeavors.

UNDERSTANDING SPARK STRUCTURED STREAMING

Spark Structured Streaming is a scalable and fault-tolerant stream processing engine built on the Spark platform. It allows you to express your streaming computation the same way you would express a batch computation on static data. This unified approach simplifies the devel-opment process and makes switching between batch and stream processing almost effortless. Figure 4-19 illustrates the Spark Structured Streaming workflow.
Skill 4.2 Describe consideration for real-time data analytics     CHAPTER 4 125

FIGURE 4-19  Spark Structured Streaming

DISTINGUISHING FEATURES AND ADVANTAGES

Spark Structured Streaming not only enhances performance but also simplifies the complexi-ties of real-time data handling. Its distinct advantages lie in its ease of use, accuracy, and integration capabilities.

Here are some of its distinguishing features and advantages:

■■ Unified API: One of the hallmarks of Structured Streaming is its API consistency. You can use the same dataset/dataframe API for both batch and streaming data, making your codebase more streamlined and maintainable.

■■ Event-time processing: It supports window-based operations, allowing you to group records by event-time windows, which is particularly useful when dealing with out-of-order data or when processing data generated in different time zones.

■■ Fault tolerance: With built-in checkpointing and state management, Spark ensures data integrity and allows for seamless recovery from failures.
■■ Integration with popular data sources and sinks: Structured Streaming supports a vast array of sources (such as Kafka, Flume, and Kinesis) and sinks (such as databases, dashboards, and even file systems), providing immense flexibility in how you handle your data streams.

For example, imagine managing a vast transportation network with hundreds of sensors on roads, bridges, and tunnels. These sensors emit data every second, capturing traffic volumes, vehicle speeds, and even environmental conditions. With Spark Structured Streaming, you can ingest this real-time data and process it to gain insights instantly. For instance, analyzing traffic patterns in real time can help pre-empt congestion, making proactive traffic management decisions possible. Similarly, the rapid analysis of environmental data can warn about adverse conditions, allowing for timely interventions.

Spark Structured Streaming, with its powerful capabilities, sets the standard for real-time data processing. Whether your use case revolves around real-time analytics, monitoring, or any scenario that requires instantaneous insights from streaming data, Structured Streaming stands ready to deliver.

126 CHAPTER 4 Describe an analytics workload on Azure

Describe data visualization in Microsoft Power BI – Describe an analytics workload on Azure

Skill 4.3 Describe data visualization in Microsoft Power BI

Dive into the transformative world of data visualization with Microsoft Power BI, a tool that not only brings your data to life but also empowers you to extract insights with unparalleled ease and finesse. As you delve deeper into this segment, imagine the vast swathes of data, currently sitting in spreadsheets or databases and metamorphosing into vibrant charts, intricate graphs, and interactive dashboards. With Power BI, you can tailor every detail of your visualizations to your precise needs.

Picture a dashboard where sales metrics, customer demographics, and operational efficien-cies merge seamlessly, with each visual element telling its part of the larger story, as shown in Figure 4-20. That’s the promise of Power BI, a canvas where data finds its voice. And while the visual elements captivate, remember that beneath them lie robust analytical capabilities. Want to drill down into a specific data point? Curious about trends over time? Power BI is more than up to the task, offering you both the broad view and the minute details.

In this section, you’ll encounter vivid examples that underscore the versatility and power of Power BI. From crafting simple bar charts to designing multidimensional maps, you’ll learn the art and science of making data dance to your tune.

And while our guidance here is comprehensive, Power BI’s expansive capabilities mean

there’s always more to explore. Consider referring to Microsoft’s official resources for deeper dives, advanced tutorials, and community-driven insights. Let’s embark on this enlightening journey, ensuring that, by its end, you’re not just a data analyst but also a data storyteller.

FIGURE 4-20  Power BI interactive dashboard

Skill 4.3 Describe data visualization in Microsoft Power BI    CHAPTER 4     127

This skill covers how to:

  • Identify capabilities of Power BI
  • Describe features of data models in Power BI

Identify capabilities of Power BI – Describe an analytics workload on Azure

Identify capabilities of Power BI

When you dive into Power BI, you’re immersing yourself in a universe of functionalities, each tailored to elevate your data visualization and analytical skills. Here’s a guide to help you navi-gate and harness the essential capabilities of this remarkable tool.

  • Seamless data integration: At the heart of every great visualization lies the data that drives it. With Power BI you can connect effortlessly to a diverse range of data sources, be it local databases, cloud-based solutions, Excel spreadsheets, or third-party plat-forms, as shown in Figure 4-21. The beauty of it is that once the data is connected, you can consolidate and transform that data, paving the way for rich, meaningful visualizations.

FIGURE 4-21 Power BI data ingestion process

  • Intuitive drag-and-drop features: You don’t need to be a coding wizard to craft com-pelling visuals in Power BI. With its user-friendly interface, designing everything from simple charts to complex dashboards becomes an intuitive, drag-and-drop affair. Pic-ture yourself effortlessly juxtaposing a line graph next to a pie chart, bringing multiple data stories into a coherent narrative.
  • Advanced data modeling: Beyond its visualization prowess, Power BI arms you with robust data modeling tools. With features like Data Analysis Expressions (DAX), you can create custom calculations, derive new measures, and model your data in ways that resonate best with your analysis needs.

128 CHAPTER 4   Describe an analytics workload on Azure

  • Interactive reports and dashboards: Static visuals tell only half the story. With Power BI, your visualizations come alive, offering interactive capabilities that encourage exploration. Imagine a sales dashboard where clicking a region dynamically updates all associated charts, revealing granular insights with a mere click.
  • Collaboration and sharing: Crafting the perfect visualization is one thing; sharing it is another. Power BI streamlines collaboration, meaning you can publish reports, share dashboards, and even embed visuals into apps or websites. Your insights, once confined to your device, can now reach a global audience or targeted stakeholders with ease.

As a practical example, consider you’re managing the sales division for a global enter-prise. With Power BI, you can effortlessly integrate sales data from various regions, model it to account for currency differences, and craft a dynamic dashboard. Now, with a simple click, stakeholders can dive into regional sales, identify top-performing products, and even forecast future trends. As your proficiency with Power BI grows, there’s always more to discover. As you chart your data journey with Power BI, remember that every insight you unearth has the potential to inform, inspire, and innovate.

Describe features of data models in Power BI – Describe an analytics workload on Azure

Describe features of data models in Power BI

When you work with Power BI, you’re not just interacting with visual representations of data; you’re engaging with a meticulously structured data model. The depth and breadth of this model dictate the stories you can extract from your data. This section is a more detailed guide to the intricate features of data models in Power BI and how they set the stage for data-driven narratives.

Relationships

At the heart of your data model are relationships. They let you connect different tables for richer, multidimensional analysis. Think of relationships as bridging islands of data so they can talk to each other. For instance, as shown in Figure 4-22, you can link a Sales table to a Products table to reveal insights about which products drive the most revenue.
Skill 4.3 Describe data visualization in Microsoft Power BI  CHAPTER 4 129

FIGURE 4-22  Power BI table (entity) relationship

BASICS OF TABLE RELATIONSHIPS

In the world of data modeling, especially within tools like Power BI, understanding the basics of table relationships is akin to learning the grammar of a language. These relationships are fundamental to how you interpret and interact with your data. Central to these relationships are concepts like keys and their types, the nature of the connections between tables, and the impact of these connections on data filtering and analysis. Here’s a closer look at these founda-tional elements:

■■ Primary and foreign keys: At the heart of any table relationship is the concept of keys.A primary key is a unique identifier for a record in a table. In contrast, a foreign key in one table points to the primary key in another table, establishing a link between them. It’s this connection that facilitates data retrieval across multiple tables.

■■ One-to-many and many-to-one relationships: These are the most common types of relationships you’ll encounter. In a one-to-many relationship, a single record in the first table can relate to multiple records in the second table, but not vice versa. Conversely, in many-to-one relationships, multiple records from the first table correspond to a single record in the second table.

■■ Many-to-many relationships: Occasionally, you might find that multiple records in one table relate to multiple records in another table. This complex relationship type,

130 CHAPTER 4 Describe an analytics workload on Azure

known as many-to-many, was historically handled using bridge tables, but Power BI now offers native support, simplifying its implementation.

■■ Cross-filtering and direction: Relationships in Power BI have a direction, dictating how filters are applied across related tables. This directionality ensures that when you apply a filter to one table, related tables are automatically filtered, preserving data context and integrity.