Identify Microsoft cloud services for real-time analytics – Describe an analytics workload on Azure

Identify Microsoft cloud services for real-time analytics

In an age where decisions must often be made at the blink of an eye, the role of real-time analytics has become paramount. The ability to rapidly sift through vast streams of data, distill meaningful insights, and act on them instantaneously can often mean the difference between seizing an opportunity or missing it entirely. But beyond the buzzwords, what does real-time analytics truly entail, especially when you’re navigating the vast offerings of the Azure ecosys-tem? This section will guide you through Azure’s real-time analytics technologies, demystifying their capabilities and applications and setting you on a course to harness their full potential. From understanding the prowess of Azure Stream Analytics to grasping the nuances of Azure Synapse Data Explorer and Spark structured streaming, you’re about to get to the heart of instant data processing and analytics.

■ Stream processing platforms: At the center stage of real-time analytics are stream processing platforms. A stalwart example is Azure Stream Analytics, which you can use to ingest, process, and analyze data as it flows. To visualize its power, consider moni-toring a vast power grid, instantly detecting surges, and redirecting power to prevent outages. Just like the grid managers, you can harness Azure Stream Analytics to react immediately to your business’s data.

■ Azure Synapse Data Explorer: This isn’t just another tool—it’s your window into the massive streams of data you’re dealing with. With Azure Synapse Data Explorer you can

120 CHAPTER 4 Describe an analytics workload on Azure

query, visualize, and explore your data in real time. It’s like having a magnifying glass over a rushing river of data, where you can pick out and examine individual drops (or data points) as they flow by.

■■ Spark Structured Streaming: An integral part of the Apache Spark ecosystem, Spark Structured Streaming facilitates scalable and fault-tolerant stream processing of live data streams. Imagine standing amidst a bustling stock market, with traders shouting orders and prices fluctuating wildly. Now, imagine you could process, aggregate, and make sense of all that data in real time. That’s the magic Spark Structured Streaming brings to the table. Figure 4-16 shows you streaming lines of data converging into structured blocks of information.
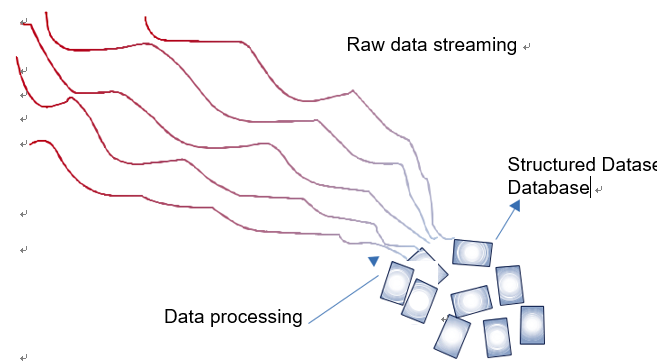
FIGURE 4-16 Streaming data converging into structured datasets

■■ Message brokers: Azure Event Hubs stands tall as a premier message broker. As you navigate the labyrinth of real-time data, you’ll realize the critical role of these brokers in ensuring data is delivered reliably and promptly to the systems that process them. It’s the backbone, the silent carrier ensuring every piece of data reaches its destination.

■■ NoSQL databases: In the realm of real-time data, traditional databases can become bottlenecks. This is where powerhouses like Cosmos DB shine. Designed for breakneck speeds and unmatched scalability, they provide the storage that might be required for the deluge of real-time data. If you’ve ever wondered how global social media platforms can show trending topics within seconds of an event unfolding, NoSQL databases are a big part of that answer.

■■ Data visualization tools: The journey from data to decision is completed when insights are visualized and made actionable. Power BI serves as a beacon here, integrating with real-time analytics platforms to deliver live data dashboards. These aren’t just numbers and graphs; they’re the pulse of your operations, showcased in real time.

The ecosystem of real-time analytics is vast and ever-evolving. As you delve deeper, be pre-pared to witness the symphony of technologies working in unison, each playing its unique note in the grand composition of real-time insights. Each technology, be it Azure Stream Analytics,

Skill 4.2 Describe consideration for real-time data analytics CHAPTER 4 121

Azure Synapse Data Explorer, or Spark Structured Streaming, has its own nuances, applications, and potentials.
Semi-structured Data – Core Data Concepts

Semi-structured Data

Semi-structured data has some structure to it but no defined schema. This allows data to be written to and read from very quickly since the storage engine does not reorganize the data to meet a rigid format. While the lack of a defined schema naturally eliminates most of the data volatility concerns that come with structured data, it makes analytical queries more complicated as there isn’t a reliable schema to use when creating the query.

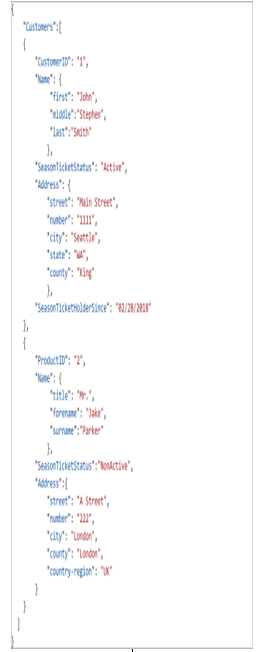
The most popular examples of semi-structured datasets are XML and JSON files. JSON specifically is very popular for sharing data via a web API. JSON stores data as objects in arrays, which allows an easy transfer of data. Both XML and JSON formats have somewhat of a structure but are flexible enough that some objects may have more or fewer attributes than others. Because the structure of the data is more fluid than that of a database with a schema, we typically refer to querying semi-structured data as schema-on-read. This means that the query definition creates a sort of quasi-schema for the data to fit in. Figure 1.6 demonstrates how JSON can be used to store data for multiple customers while including different fields for each customer.

There are multiple ways that we can store semi-structured data, varying from NoSQL databases such as Azure Cosmos DB (see Chapter 3) to files in an Azure storage account (see Chapter 4). Relational databases such as SQL Server, Azure SQL Database, and Azure Synapse Analytics can also handle semi-structured data with the native JSON and XML data types. While this creates a convenient way for data practitioners to manage structured and semi-structured data in the same location, it is recommended to limit the amount of semi-structured data you store in a relational database to very little or none.

Semi-structured data can also be stored in other types of NoSQL data stores, such as key-value stores, columnar databases, and graph databases.

FIGURE 1.6 JSON example

Azure Stream Analytics – Describe an analytics workload on Azure

Azure Stream Analytics

In today’s data-driven world, the need to react immediately to unfolding events has never been greater. Picture yourself on the trading floor, where milliseconds can decide millions. Or consider a bustling metropolis where urban sensors constantly monitor traffic, air quality, and energy consumption. Azure Stream Analytics is Microsoft’s answer to the challenges of real-time data ingestion, processing, and analytics.

Azure Stream Analytics is a real-time event data processing service that you can use to har-ness the power of fast-moving streams of data. But what does it really mean for you?

WHY AZURE STREAM ANALYTICS?

Azure Stream Analytics brings the following tools to your toolkit:

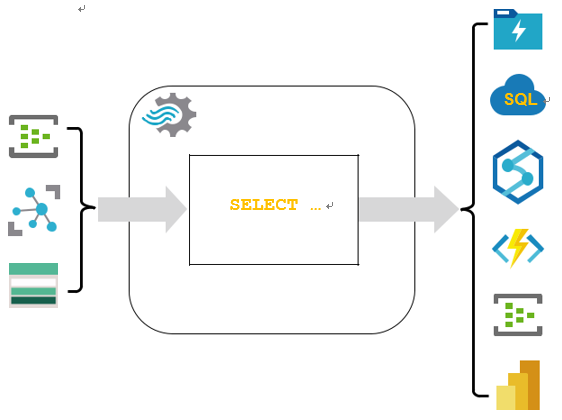
■■ Seamless integration: Azure Stream Analytics beautifully integrates with other Azure services. Whether you’re pulling data from IoT Hub, Event Hub, or Blob Storage, Stream Analytics acts as your cohesive layer, processing and redirecting the data to databases, dashboards, or even other applications, as shown in Figure 4-17.

■■ SQL-based query language: You don’t need to be a programming wizard to harness Azure Stream Analytics. If you’re familiar with SQL, you’re already ahead of the curve. Stream Analytics employs a SQL-like language, allowing you to create transformation queries on your real-time data.

FIGURE 4-17  Azure Stream Analytics

■■ Scalability and reliability: One of the hallmarks of Azure Stream Analytics is its abil-ity to scale. Whether you’re processing a few records or millions every second, Stream Analytics can handle it. More so, its built-in recovery capabilities ensure that no data is lost in the case of failures.

122 CHAPTER 4     Describe an analytics workload on Azure

■■ Real-time dashboards: Azure Stream Analytics is not just about processing; it’s also about visualization. With its ability to integrate seamlessly with tools like Power BI, you can access real-time dashboards that update as events unfold.

■■ Time windowing: One of the stand-out features you’ll appreciate is the ease with which you can perform operations over specific time windows—be it tumbling, sliding, or hopping. For instance, you might want to calculate the average temperature from IoT sensors every five minutes; Stream Analytics has got you covered.

Tumbling window in stream processing refers to a fixed-duration, nonoverlapping interval used to segment time-series data. Each piece of data falls into exactly one window, defined by a distinct start and end time, ensuring that data groups are mutu-ally exclusive. For instance, with a 5-minute tumbling window, data from 00:00 to 00:04 would be aggregated in one window, and data from 00:05 to 00:09 in the next, facilitat-ing structured, periodic analysis of streaming data.

Sliding window in stream processing is a type of data analysis technique where the window of time for data aggregation “slides” continuously over the data stream. This means that the window moves forward by a specified slide interval, and it overlaps with previous windows. Each window has a fixed length, but unlike tumbling windows, sliding windows can cover overlapping periods of time, allowing for more frequent analysis and updates. For example, if you have a sliding window of 10 minutes with a slide interval of 5 minutes, a new window starts every 5 minutes, and each window overlaps with the previous one for 5 minutes, providing a more continuous and overlapping view of the data stream.

Hopping window in stream processing is a time-based window that moves forward in fixed increments, known as the hop size. Each window has a specified duration, and the start of the next window is determined by the hop size rather than the end of the previ-ous window. This approach allows for overlaps between windows, where data can be included in multiple consecutive windows if it falls within their time frames. For example, with a window duration of 10 minutes and a hop size of 5 minutes, a new window starts every 5 minutes, and each window overlaps with the next one for a duration determined by the difference between the window size and the hop size.

■■ Anomaly detection: Dive into the built-in machine learning capabilities to detect anomalies in your real-time data streams. Whether you’re monitoring web clickstreams or machinery in a factory, Azure Stream Analytics can alert you to significant deviations in patterns.

As a practical example to truly appreciate the potential of Azure Stream Analytics, consider a smart city initiative. Urban sensors, spread across the city, send real-time data about traf-fic, energy consumption, and more. Through Azure Stream Analytics, this data is ingested in real time, processed to detect any irregularities such as traffic jams or power surges, and then passed on to Power BI dashboards that city officials monitor. The officials can then take imme-diate action, such as rerouting traffic or adjusting power distribution.

Skill 4.2 Describe consideration for real-time data analytics     CHAPTER 4      123

In summary, Azure Stream Analytics is a tool for those yearning to transform raw, real-time data streams into actionable, meaningful insights. And as you delve deeper into its features and integrations, you’ll realize that its possibilities are vast and ever-evolving.

Spark Structured Streaming – Describe an analytics workload on Azure

Spark Structured Streaming

In today’s fast-paced digital landscape, staying ahead often requires having the right tools to process and analyze streaming data seamlessly. While there are numerous technologies at the forefront of this revolution, Apache Spark’s Structured Streaming stands out as an exceptional choice. This section will guide you through its intricacies, helping you grasp its underpinnings and recognize how it can be a game-changer in your real-time analytics endeavors.

UNDERSTANDING SPARK STRUCTURED STREAMING

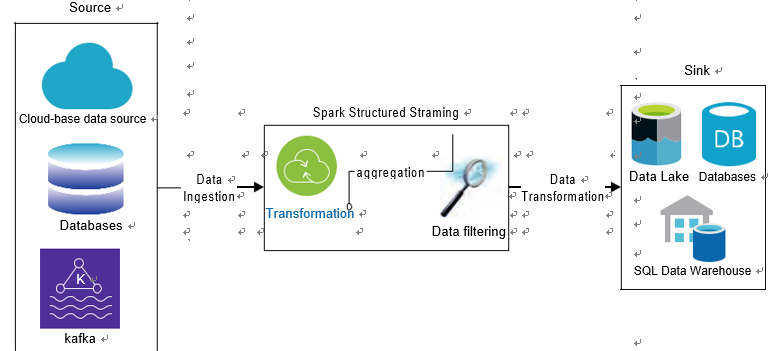
Spark Structured Streaming is a scalable and fault-tolerant stream processing engine built on the Spark platform. It allows you to express your streaming computation the same way you would express a batch computation on static data. This unified approach simplifies the devel-opment process and makes switching between batch and stream processing almost effortless. Figure 4-19 illustrates the Spark Structured Streaming workflow.
Skill 4.2 Describe consideration for real-time data analytics     CHAPTER 4 125

FIGURE 4-19  Spark Structured Streaming

DISTINGUISHING FEATURES AND ADVANTAGES

Spark Structured Streaming not only enhances performance but also simplifies the complexi-ties of real-time data handling. Its distinct advantages lie in its ease of use, accuracy, and integration capabilities.

Here are some of its distinguishing features and advantages:

■■ Unified API: One of the hallmarks of Structured Streaming is its API consistency. You can use the same dataset/dataframe API for both batch and streaming data, making your codebase more streamlined and maintainable.

■■ Event-time processing: It supports window-based operations, allowing you to group records by event-time windows, which is particularly useful when dealing with out-of-order data or when processing data generated in different time zones.

■■ Fault tolerance: With built-in checkpointing and state management, Spark ensures data integrity and allows for seamless recovery from failures.
■■ Integration with popular data sources and sinks: Structured Streaming supports a vast array of sources (such as Kafka, Flume, and Kinesis) and sinks (such as databases, dashboards, and even file systems), providing immense flexibility in how you handle your data streams.

For example, imagine managing a vast transportation network with hundreds of sensors on roads, bridges, and tunnels. These sensors emit data every second, capturing traffic volumes, vehicle speeds, and even environmental conditions. With Spark Structured Streaming, you can ingest this real-time data and process it to gain insights instantly. For instance, analyzing traffic patterns in real time can help pre-empt congestion, making proactive traffic management decisions possible. Similarly, the rapid analysis of environmental data can warn about adverse conditions, allowing for timely interventions.

Spark Structured Streaming, with its powerful capabilities, sets the standard for real-time data processing. Whether your use case revolves around real-time analytics, monitoring, or any scenario that requires instantaneous insights from streaming data, Structured Streaming stands ready to deliver.

126 CHAPTER 4 Describe an analytics workload on Azure

Describe features of data models in Power BI – Describe an analytics workload on Azure

Describe features of data models in Power BI

When you work with Power BI, you’re not just interacting with visual representations of data; you’re engaging with a meticulously structured data model. The depth and breadth of this model dictate the stories you can extract from your data. This section is a more detailed guide to the intricate features of data models in Power BI and how they set the stage for data-driven narratives.

Relationships

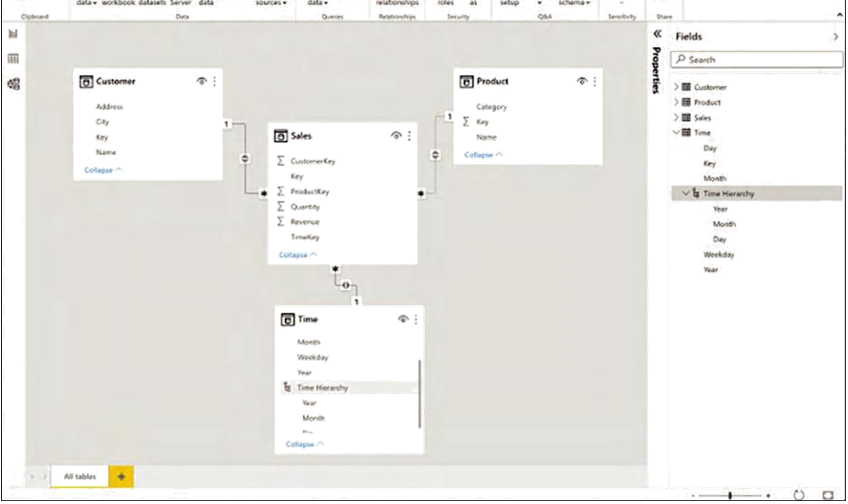
At the heart of your data model are relationships. They let you connect different tables for richer, multidimensional analysis. Think of relationships as bridging islands of data so they can talk to each other. For instance, as shown in Figure 4-22, you can link a Sales table to a Products table to reveal insights about which products drive the most revenue.
Skill 4.3 Describe data visualization in Microsoft Power BI  CHAPTER 4 129

FIGURE 4-22  Power BI table (entity) relationship

BASICS OF TABLE RELATIONSHIPS

In the world of data modeling, especially within tools like Power BI, understanding the basics of table relationships is akin to learning the grammar of a language. These relationships are fundamental to how you interpret and interact with your data. Central to these relationships are concepts like keys and their types, the nature of the connections between tables, and the impact of these connections on data filtering and analysis. Here’s a closer look at these founda-tional elements:

■■ Primary and foreign keys: At the heart of any table relationship is the concept of keys.A primary key is a unique identifier for a record in a table. In contrast, a foreign key in one table points to the primary key in another table, establishing a link between them. It’s this connection that facilitates data retrieval across multiple tables.

■■ One-to-many and many-to-one relationships: These are the most common types of relationships you’ll encounter. In a one-to-many relationship, a single record in the first table can relate to multiple records in the second table, but not vice versa. Conversely, in many-to-one relationships, multiple records from the first table correspond to a single record in the second table.

■■ Many-to-many relationships: Occasionally, you might find that multiple records in one table relate to multiple records in another table. This complex relationship type,

130 CHAPTER 4 Describe an analytics workload on Azure

known as many-to-many, was historically handled using bridge tables, but Power BI now offers native support, simplifying its implementation.

■■ Cross-filtering and direction: Relationships in Power BI have a direction, dictating how filters are applied across related tables. This directionality ensures that when you apply a filter to one table, related tables are automatically filtered, preserving data context and integrity.

Hierarchies – Describe an analytics workload on Azure

Hierarchies

Hierarchies in Power BI allow you to layer different fields in a structured order, offering a mul-tilevel perspective on your data. At a basic level, think of hierarchies as ladders of information, where each rung offers a more granular view than the last.

For instance, in a time hierarchy, you might start with years and descend to months, then weeks, and, finally, days. Each level represents a deeper dive into your data, allowing for

132 CHAPTER 4   Describe an analytics workload on Azure

detailed drill-down analysis. As shown in Figure 4-25, you are able to view your total yearly sales and then drill down to see a more detailed breakdown of your yearly sales by month.

FIGURE 4-25  Power BI hierarchies

WHY HIERARCHIES MATTER

In the realm of data analytics within Power BI, hierarchies represent a fundamental and sophisticated mechanism for organizing and dissecting complex datasets. These structured frameworks are not merely for organizational clarity; they serve as critical tools for enhanc-ing analytical depth and navigational efficiency. Hierarchies in Power BI facilitate a multilay-ered approach to data examination, providing a powerful means to dissect, understand, and visualize data in a methodical and meaningful way. The following are some essential facets of hierarchies that underscore their significance in professional and technical data analysis:

■■ Efficient data exploration: With hierarchies, you can seamlessly navigate between different levels of data. This efficiency facilitates intuitive data exploration, letting you zoom in on details or pull back to view broader trends.

■■ Enhanced visualizations: Hierarchies bring a dynamic dimension to visualizations. Whether it’s a column chart or a map, the ability to drill down through hierarchical levels enriches the visual story, making it more interactive and engaging.

■■ Consistent analysis framework: Hierarchies provide a structured framework for analy-sis. By establishing a clear order of fields, they ensure consistency in how data is viewed and analyzed across reports and dashboards.

CONSTRUCTING HIERARCHIES – Describe an analytics workload on Azure

CONSTRUCTING HIERARCHIES

Creating a hierarchy in Power BI is straightforward. In the Fields pane, you can simply drag one field onto another to initiate a hierarchy. From there, you can add or rearrange fields, tailoring the hierarchy to your analytical needs.

A PRACTICAL ILLUSTRATION

Imagine managing a retail chain with stores across multiple countries. You could construct a geographical hierarchy with the following levels:

Continent (e.g., North America)

Country (e.g., United States)

State (e.g., California)

Skill 4.3 Describe data visualization in Microsoft Power BI    CHAPTER 4      133

City (e.g., San Francisco)

Store Location (e.g., Market Street)

With this hierarchy in place, a map visualization in Power BI becomes a dynamic exploration tool. At the highest level, you see sales by continent. As you drill down, you traverse through countries, states, and cities, finally landing on individual store locations. This hierarchical jour-ney offers insights ranging from global sales trends down to the performance of a single store.

In the realm of Power BI, hierarchies are more than just structural tools; they’re gateways to layered insights. By understanding and adeptly utilizing them, you can craft data stories that resonate with depth, clarity, and context.

Measures and Calculated Columns

Data seldom fits perfectly into our analytical narratives. Often, it requires tweaking, transfor-mation, or entirely new computations to reveal the insights we seek. Power BI acknowledges this need with two potent features: measures and calculated columns. These tools, driven by the powerful DAX language, grant you the capability to sculpt and refine your data. Here, we’ll dive deep into these features, elucidating their distinctions and utilities and bringing them to life with hands-on examples.

A measure is a calculation applied to a dataset, usually an aggregation like sum, average, or count, that dynamically updates based on the context in which it’s used. For instance, the same measure can provide the total sales for an entire year, a specific month, or even a single prod-uct, depending on the visualization or filter context. Measures are immensely useful when you want to examine aggregated data. They respond to user interactions, ensuring that as filters or slicers are applied to a report, the measures reflect the appropriate, contextual data.

A calculated column is a custom column added to an existing table in your data model. The values of this column are computed during data load and are based on a DAX formula that uses existing columns. When you need a new column that’s derived from existing data—for computations or classifications—a calculated column is the go-to tool. Unlike measures, these values remain static and are calculated row by row.

Measures are for aggregating and are context-aware, while calculated columns add new, static data to your tables.

As an example, imagine you’re analyzing sales data for a chain of bookstores. You might create a measure named Total Sales using the formula Total Sales = SUM(Transactions[SalesAmount]). This measure can display total sales across all stores but will adjust to show sales for a specific store if you filter by one.

134 CHAPTER 4   Describe an analytics workload on Azure

Using the same bookstore data, suppose you want to classify books into price categories: Budget, Mid-Range, and Premium. You can create a calculated column named Price Category with a formula like this:

This adds a new Price Category column to your Books table, classifying each book based on its price.

Harnessing measures and calculated columns in Power BI are akin to being handed a chisel as you sculpt a statue from a block of marble. They allow you to shape, refine, and perfect your data, ensuring your analyses and visualizations are both precise and insightful. To delve deeper into the world of DAX and custom calculations, the official Microsoft documentation provides a treasure trove of knowledge, from foundational concepts to advanced techniques.

Data categorization – Describe an analytics workload on Azure

Data categorization

Data categorization in Power BI involves assigning a specific type or category to a data column, thereby providing hints to Power BI about the nature of the data. This categorization ensures that Power BI understands and appropriately represents the data, especially when used in visu-als or calculations.

WHY DATA CATEGORIZATION MATTERS

Data categorization in Power BI is pivotal for extracting maximum value from your datasets, impacting everything from visualization choices to data integrity. It enables Power BI to pro-vide tailored visual suggestions, enhances the effectiveness of natural language queries, and serves as a critical tool for data validation. Here’s why categorizing your data correctly matters:

  • Enhanced visualization interpretation: By understanding the context of your data, Power BI can auto-suggest relevant visuals. Geographical data, for instance, would prompt map-based visualizations, while date fields might suggest time-series charts.
  • Improved search and Q&A features: Power BI’s Q&A tool, which allows natural language queries, leans on data categorization. When you ask for “sales by city,” the tool knows to reference geographical data due to the categorization of the City column.
  • Data validation: Categorization can act as a form of data validation. By marking a column as a date, any nondate values become evident, highlighting potential data quality issues.

Skill 4.3 Describe data visualization in Microsoft Power BI    CHAPTER 4    135

COMMON DATA TYPES IN POWER BI

In Power BI, the clarity and accuracy of your reports hinge on understanding the core data types at your disposal. Each data type serves a specific purpose, shaping how information is stored, analyzed, and presented. The following are common data types:

  • Text: Generic textual data, from product names to descriptions
  • Whole number: Numeric data without decimal points, like quantities or counts
  • Decimal number: Numeric data with decimal precision, suitable for price or rate data
  • Date/time: Fields that have timestamps, including date, time, or both

About possible exam updates – DP-900 Microsoft Azure Data Fundamentals Exam Updates

About possible exam updates

Microsoft reviews exam content periodically to ensure that it aligns with the technology and job role associated with the exam. This includes, but is not limited to, incorporating function-ality and features related to technology changes, changing skills needed for success within a job role, and revisions to product names. Microsoft updates the exam details page to notify candidates when changes occur. If you have registered this book and an update occurs to this chapter, you will be notified by Microsoft Press about the availability of this updated chapter.

Impact on you and your study plan

Microsoft’s information helps you plan, but it also means that the exam might change before you pass the current exam. That impacts you, affecting how we deliver this book to you. This chapter gives us a way to communicate in detail about those changes as they occur. But you should keep an eye on other spaces as well.

For those other information sources to watch, bookmark and check these sites for news:

Microsoft Learn: Check the main source for up-to-date information: microsoft.com/ learn. Make sure to sign up for automatic notifications at that page.

Microsoft Press: Find information about products, offers, discounts, and free down-

loads: microsoftpressstore.com. Make sure to register your purchased products.

As changes arise, we will update this chapter with more details about the exam and book content. At that point, we will publish an updated version of this chapter, listing our content plans. That detail will likely include the following:

■■ Content removed, so if you plan to take the new exam version, you can ignore those when studying
■■ New content planned per new exam topics, so you know what’s coming

The remainder of the chapter shows the new content that may change over time.

Describe Types of Core Data Workloads – Core Data Concepts

Describe Types of Core Data Workloads

The volume of data that the world has generated has exploded in recent years. Zettabytes worth of data is created every year, the variety of which is seemingly endless. Competing in a rapidly changing world requires companies to utilize massive amounts of data that they have only recently been exposed to. What’s more is that with the use of edge devices that allow Internet of Things (IoT) data to seamlessly move between the cloud and local devices, companies can make valuable data-driven decisions in real time.

It is imperative that organizations leverage data when making critical business decisions. But how do they turn raw data into usable information? How do they decide what is valuable and what is noise? With the power of cloud computing and storage costs growing cheaper and cheaper every year, it’s easy for companies to store all the data at their disposal and build creative solutions that combine a multitude of different design patterns. For example, modern data storage and computing techniques allow sports franchises to create more sophisticated training programs by combining traditional statistical information with real-time data captured from sensors that measure features such as speed and agility. E-commerce companies leverage click-stream data to track a user’s activity while on their website, allowing them to build custom experiences for customers to reduce customer churn.

The exponential growth in data and the number of sources organizations can leverage to make decisions have put an increased focus on making the right solution design decisions. Deciding on the most optimal data store for the different types of data involved and the most optimal analytical pattern for processing data can make or break a project before it ever gets started. Ultimately, there are four key questions that need to be answered when making design decisions for a data-driven solution:

  • What value will the data powering the solution provide?
  • How large is the volume of data involved?
  • What is the variety of the data included in the solution?
  • What is the velocity of the data that will be ingested in the target platform?