CONSTRUCTING HIERARCHIES
Creating a hierarchy in Power BI is straightforward. In the Fields pane, you can simply drag one field onto another to initiate a hierarchy. From there, you can add or rearrange fields, tailoring the hierarchy to your analytical needs.
A PRACTICAL ILLUSTRATION
Imagine managing a retail chain with stores across multiple countries. You could construct a geographical hierarchy with the following levels:
Continent (e.g., North America)
Country (e.g., United States)
State (e.g., California)
Skill 4.3 Describe data visualization in Microsoft Power BI CHAPTER 4 133
City (e.g., San Francisco)
Store Location (e.g., Market Street)
With this hierarchy in place, a map visualization in Power BI becomes a dynamic exploration tool. At the highest level, you see sales by continent. As you drill down, you traverse through countries, states, and cities, finally landing on individual store locations. This hierarchical jour-ney offers insights ranging from global sales trends down to the performance of a single store.
In the realm of Power BI, hierarchies are more than just structural tools; they’re gateways to layered insights. By understanding and adeptly utilizing them, you can craft data stories that resonate with depth, clarity, and context.
Measures and Calculated Columns
Data seldom fits perfectly into our analytical narratives. Often, it requires tweaking, transfor-mation, or entirely new computations to reveal the insights we seek. Power BI acknowledges this need with two potent features: measures and calculated columns. These tools, driven by the powerful DAX language, grant you the capability to sculpt and refine your data. Here, we’ll dive deep into these features, elucidating their distinctions and utilities and bringing them to life with hands-on examples.
A measure is a calculation applied to a dataset, usually an aggregation like sum, average, or count, that dynamically updates based on the context in which it’s used. For instance, the same measure can provide the total sales for an entire year, a specific month, or even a single prod-uct, depending on the visualization or filter context. Measures are immensely useful when you want to examine aggregated data. They respond to user interactions, ensuring that as filters or slicers are applied to a report, the measures reflect the appropriate, contextual data.
A calculated column is a custom column added to an existing table in your data model. The values of this column are computed during data load and are based on a DAX formula that uses existing columns. When you need a new column that’s derived from existing data—for computations or classifications—a calculated column is the go-to tool. Unlike measures, these values remain static and are calculated row by row.
Measures are for aggregating and are context-aware, while calculated columns add new, static data to your tables.
As an example, imagine you’re analyzing sales data for a chain of bookstores. You might create a measure named Total Sales using the formula Total Sales = SUM(Transactions[SalesAmount]). This measure can display total sales across all stores but will adjust to show sales for a specific store if you filter by one.
134 CHAPTER 4 Describe an analytics workload on Azure
Using the same bookstore data, suppose you want to classify books into price categories: Budget, Mid-Range, and Premium. You can create a calculated column named Price Category with a formula like this:
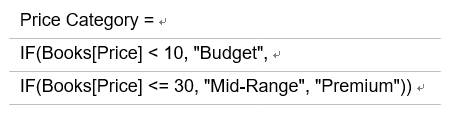
This adds a new Price Category column to your Books table, classifying each book based on its price.
Harnessing measures and calculated columns in Power BI are akin to being handed a chisel as you sculpt a statue from a block of marble. They allow you to shape, refine, and perfect your data, ensuring your analyses and visualizations are both precise and insightful. To delve deeper into the world of DAX and custom calculations, the official Microsoft documentation provides a treasure trove of knowledge, from foundational concepts to advanced techniques.