EXPLORING SCHEMAS
These are the different types of schemas:
■■ Star schema: One of the most prevalent schema designs in Power BI, the star schema consists of a central fact table surrounded by dimension tables. The fact table houses quantitative data (like sales amounts), while dimension tables contain descriptive attributes (like product names or customer details). This structure, resembling a star as shown in Figure 4-23, ensures streamlined data queries and optimal performance.
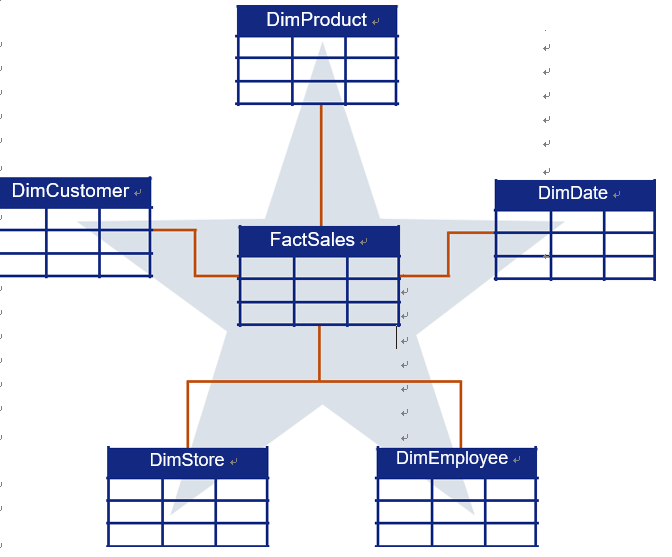
FIGURE 4-23 Star schema
- Snowflake schema: An evolution of the star schema, the snowflake schema sees dimension tables normalized into additional tables, as shown in Figure 4-24. This schema can be more complex but offers a more granulated approach to data relation-ships, making it apt for intricate datasets.
Skill 4.3 Describe data visualization in Microsoft Power BI CHAPTER 4 131

FIGURE 4-24 Snowflake schema
DimEmployee
A PRACTICAL SCENARIO
Imagine running an online bookstore. You have tables for orders, customers, books, and authors. Using the star schema, the Orders table sits at the center as your fact table, containing transaction amounts. The other tables serve as dimensions, with the Books table containing a foreign key linking to the Authors table, establishing a many-to-one relationship.
Harnessing the potential of table relationships and choosing the right schema in Power BI isn’t just a technical endeavor; it’s an art form. By understanding and correctly implementing these relationships, you’re crafting a tapestry where data flows seamlessly to offer insights that are both deep and interconnected.