Hierarchies
Hierarchies in Power BI allow you to layer different fields in a structured order, offering a mul-tilevel perspective on your data. At a basic level, think of hierarchies as ladders of information, where each rung offers a more granular view than the last.
For instance, in a time hierarchy, you might start with years and descend to months, then weeks, and, finally, days. Each level represents a deeper dive into your data, allowing for
132 CHAPTER 4 Describe an analytics workload on Azure
detailed drill-down analysis. As shown in Figure 4-25, you are able to view your total yearly sales and then drill down to see a more detailed breakdown of your yearly sales by month.
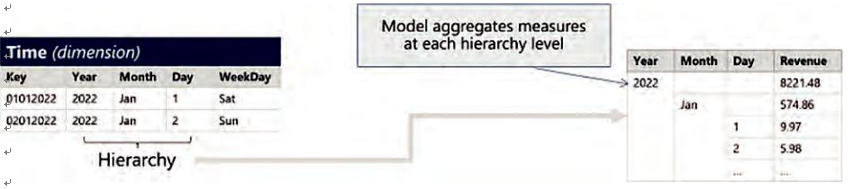
FIGURE 4-25 Power BI hierarchies
WHY HIERARCHIES MATTER
In the realm of data analytics within Power BI, hierarchies represent a fundamental and sophisticated mechanism for organizing and dissecting complex datasets. These structured frameworks are not merely for organizational clarity; they serve as critical tools for enhanc-ing analytical depth and navigational efficiency. Hierarchies in Power BI facilitate a multilay-ered approach to data examination, providing a powerful means to dissect, understand, and visualize data in a methodical and meaningful way. The following are some essential facets of hierarchies that underscore their significance in professional and technical data analysis:
■■ Efficient data exploration: With hierarchies, you can seamlessly navigate between different levels of data. This efficiency facilitates intuitive data exploration, letting you zoom in on details or pull back to view broader trends.
■■ Enhanced visualizations: Hierarchies bring a dynamic dimension to visualizations. Whether it’s a column chart or a map, the ability to drill down through hierarchical levels enriches the visual story, making it more interactive and engaging.
■■ Consistent analysis framework: Hierarchies provide a structured framework for analy-sis. By establishing a clear order of fields, they ensure consistency in how data is viewed and analyzed across reports and dashboards.